Generating Grid Files
In today’s blog post, we will demonstrate an effective method for converting your point-based data into a Grid file. A Grid file is a raster format that defines a geographic space as an array of equally sized cells arranged in rows and columns. Each cell is generated with a numeric value that represents an attribute (such as population, elevation, surface slope, soil pH etc.) You can find more background on the ESRI .grd file format here.
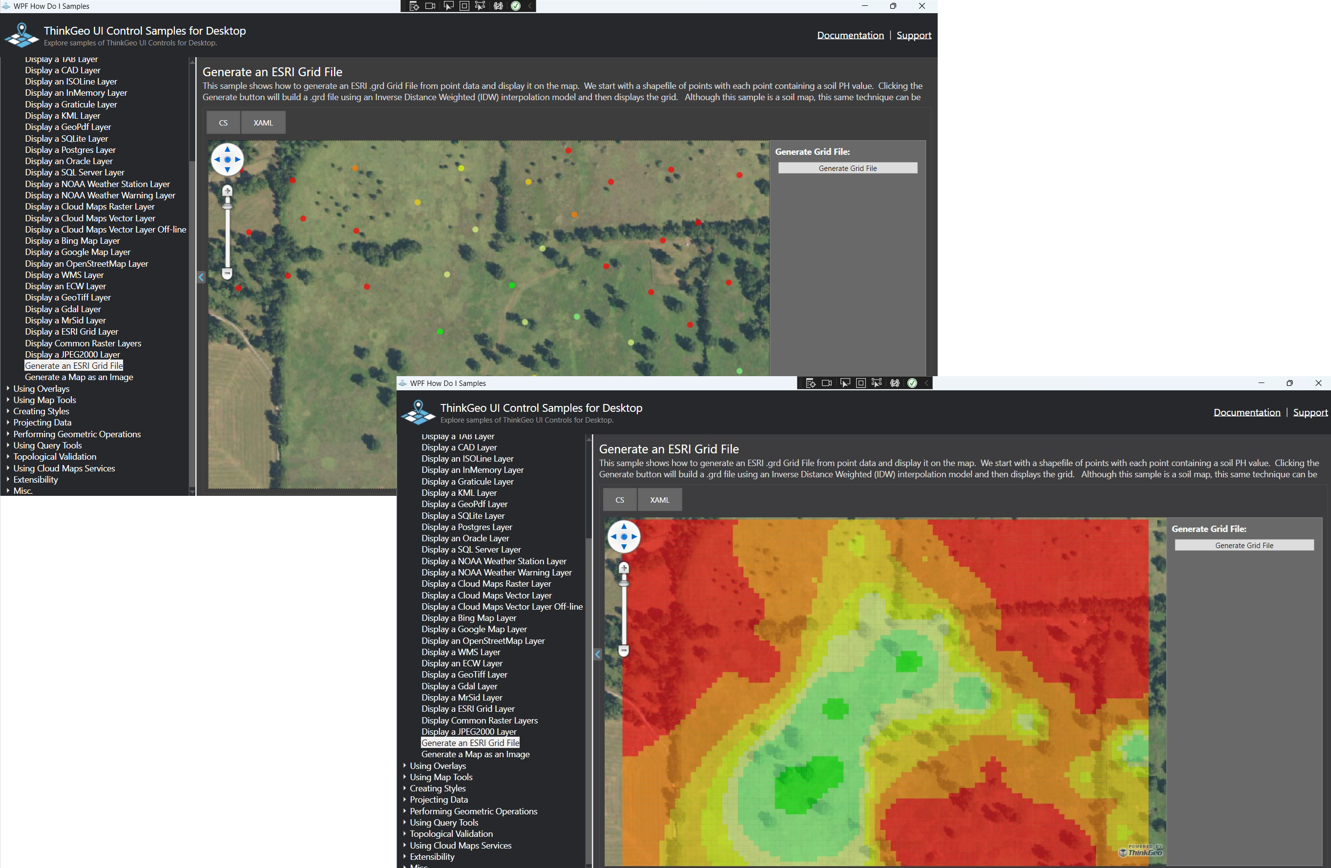
To see the sample in action, just clone the latest WPF ‘HowDoI’ samples and view the ‘Generate Grid File’ sample. While the sample above is using Wpf, the GridFeatureLayer is part of ThinkGeo.Core and also available on ThinkGeo Mobile and Web.
As you explore the code in this sample you’ll notice the GenerateGrid() function iterates through every point in the original dataset and uses the point’s soil PH attribute and the Inverse Weighted Distance algorithm for interpolation to generate the GridFeatureLayer as a raster representation of PH values across the entire field. We plan to have an in-depth blog post on the Inverse Distance Weighted Interpolation method in the future, but for now you can find more details here.
While this sample shows how to convert point-based soil PH values into a soil map grid, the same concept can be applied to any point-based dataset. From populations and temperature to elevation and slope, the possible uses for grids are endless.
If you have any questions on using Grid Files with your data, please contact sales@thinkgeo.com and we will be happy to help. Or you can sign up for a free evaluation to view our samples and start building today!