Extensibility
Extending Your Maps
ThinkGeo products are built with extensibility in mind. Being able to extend and adapt a framework to your needs is a critical aspect of its usefulness. It allows for flexibility when requirements change and gives you a way to succeed when something doesn’t do exactly what you need it to do. Each of our components is built up in a pieces-and-parts way, assembling higher level features from smaller parts. This, coupled with overridable methods, allows you change nearly any aspect of the framework.
Extensibility means you can integrate your own data sources, create your own styles, tweak existing styles, draw to alternate canvases such as to a PDF, implement your own mathematical algorithms for shapes, and so much more. There is always a way to extend ThinkGeo maps to meet your requirements, both today and in the future.
ThinkGeo APIs are designed around a concept of 'minimal necessary overriding' for our abstract classes. What this means is that when extending our source, only the absolutely necessary methods need to be overriden - all other functionality works out-of-the-box. For example, when integrating a new data source, the only method that needs to be overridden is the 'GetAllFeatures' method, which requires you to pass back all of the possible features for this data source. With just this one method, we can calculate things such as spatial queries, maximum extent, record count, etc. without needing to override any other methods. If you would like to override other methods (for example, if your underlying storage format has an index that makes spatial queries very efficient), that option is still available to you. In this way, we only require the bare minimum to make features work and provide additional optional overrides based on what your upstream system supports.
As nearly every class has extensibility points, we only show samples for the most popular ones. That being said, we are always willing to help our customers extend our platform. This includes suggestions on how to integrate something, or making changes in the product that can be consumed through daily builds to our NuGet preview channel.
Extending Styles
Styling is the lifeblood of visualizing GIS data, and we provide a great number of ready to use styles as well as a framework for combining, extending or creating your own custom styles. Custom styles allow you to use any of the column data associated with your features, while also giving you a place to implement custom logic.
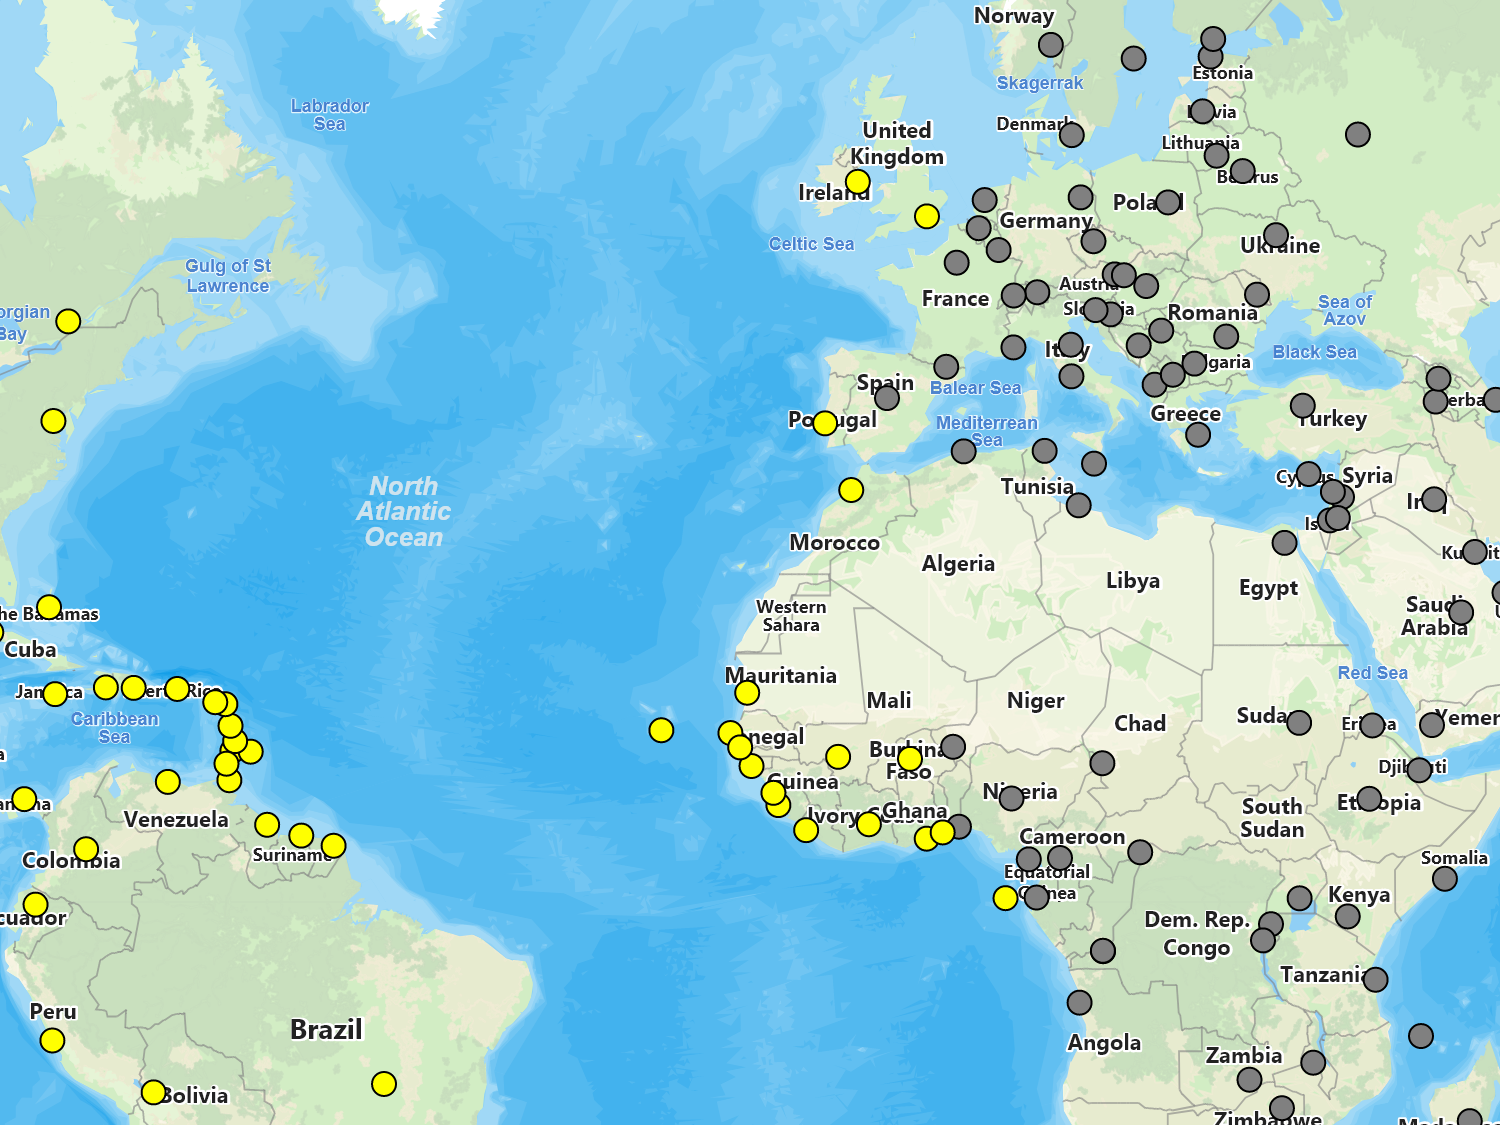
In the sample provided, we create a custom style that styles world capitols based on whether it is currently night or day at that location.
Sample Code
Extending Layers
Layers are useful for displaying data based on underlying spatial data (like shapefiles). Based on your type of data (raster, vector, or even custom data), you can create your own layers to display data formats we do not yet support, such as domain-specific or proprietary formats. This allows you to ensure that your data can easily be integrated into your maps.
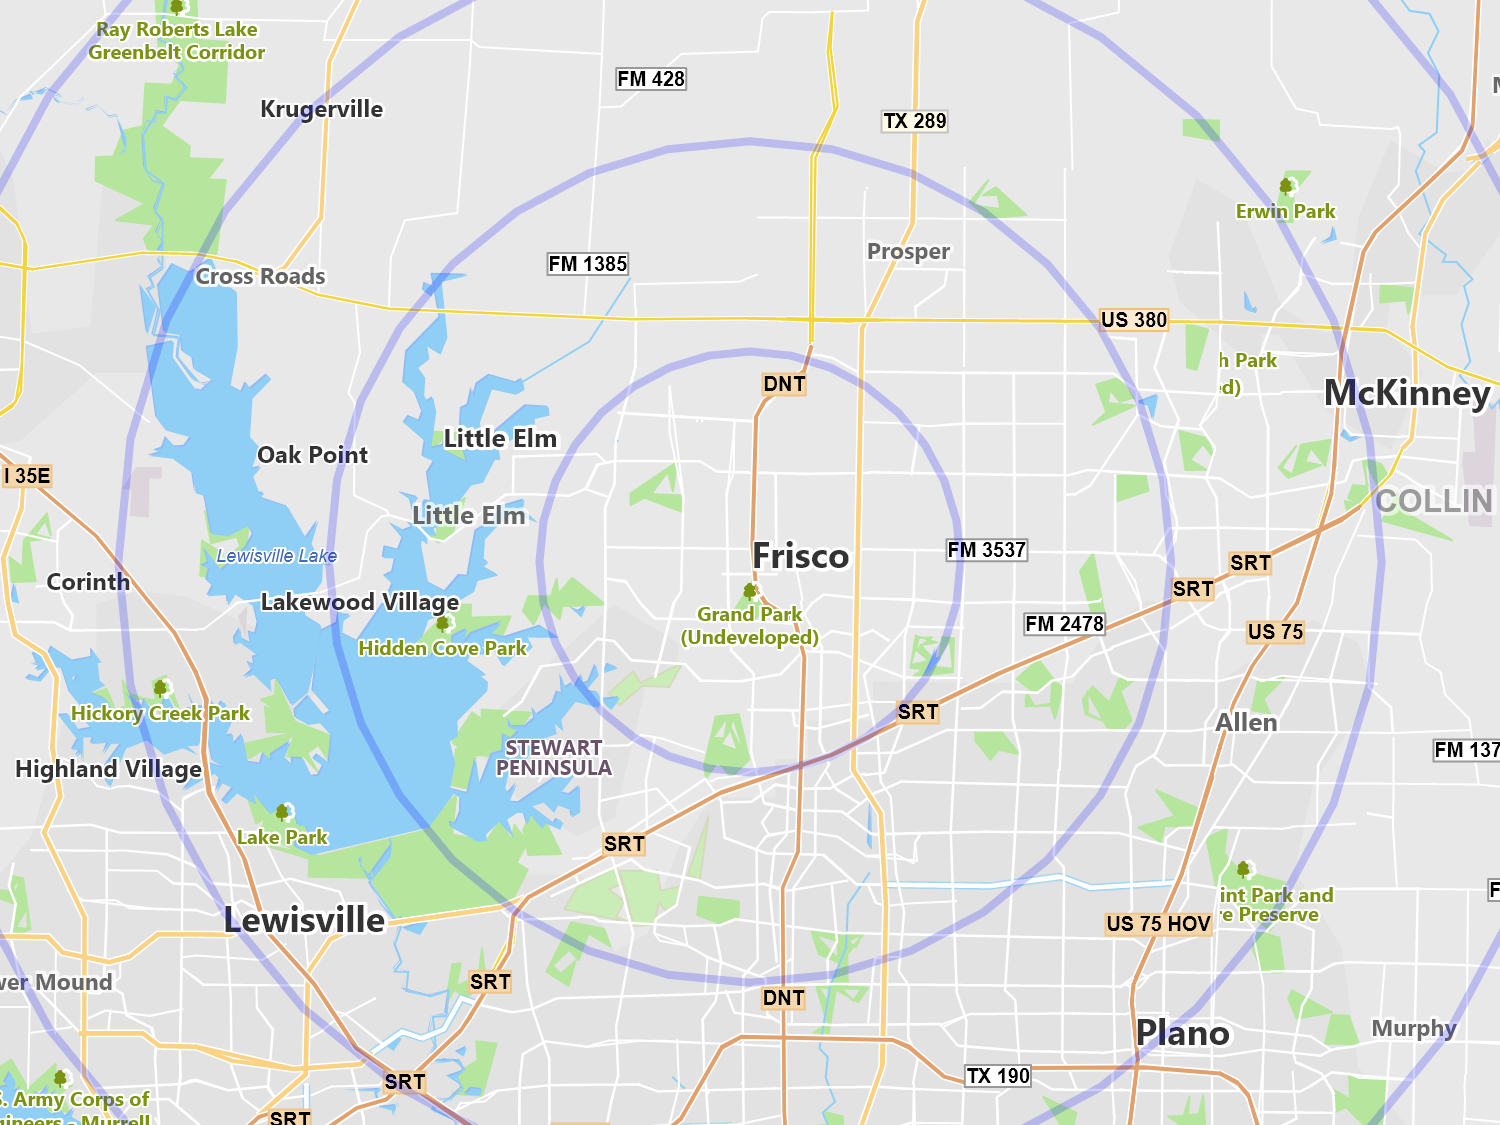
In our custom layer sample, we do something a bit different. This sample shows how a layer can even draw data not driven by any underlying data source. In the sample, we create a layer that draws rings at five mile intervals based on the center of the map. It demonstrates our drawing APIs as well as dynamic map functionality. If you are more interested in integrating data from a data source, check out the 'Extending Feature Sources' section below, where we create a custom feature source and integrate it into a custom layer.
Sample Code

Extending FeatureSources
Our FeatureSource classes are similar to more generic datasources in the .NET framework, but with an emphasis on GIS features. Creating a new FeatureSource allows you to integrate your own custom data into our map control for display or analysis. By overriding just a single API, you can integrate your own data and get the advantages of spatial queries, visualization, and much more. If your data store supports spatial indexes, those can also be leveraged to speed up spatial operations.
In the sample we show how to take a series of point data and create a custom FeatureSource and FeatureLayer that can be drawn and analyzed on the map with just a few lines of code.
Sample Code
* Feature available, but no specific sample.