
ThinkGeo Route Optimization solves the Traveling Salesman Problem
ThinkGeo Cloud Routing has kicked off the new year with the addition of the Route Optimization service, which introduces the ability to tackle the Traveling Salesman Problem or TSP as it’s commonly known.

Applying a Directional Styling in a WPF Application
This ThinkGeo WPF ApplyDirectionPointStyleForLineStyle functionality for .NET Core will guide you through drawing lineStyles in the form of directional arrows on a map. The direction Point can be an image or a glyph, it not only rotates the icon across the angle of the road, but also provides a way to customize the rotation of the direction point.

Using “ClassBreak” styling to create dynamic maps
In this project you will see how to use the ClassBreakStyle to group and render features by values. ClassBreakStyle is a useful technique as it allows you to group various features by the specified values, then applies differently style to the feature groups. One of the first steps in creating an interactive map that highlights different classes of data is creating unique iconography to translate that onto the map.

Using WPF “TextStyling” with ThinkGeo UI
When you think of displaying points on a map, usually you think of representing them with symbols or icons. ThinkGeo’s PointStyle class is typically employed here, but what if you have a font containing symbols you want to use?
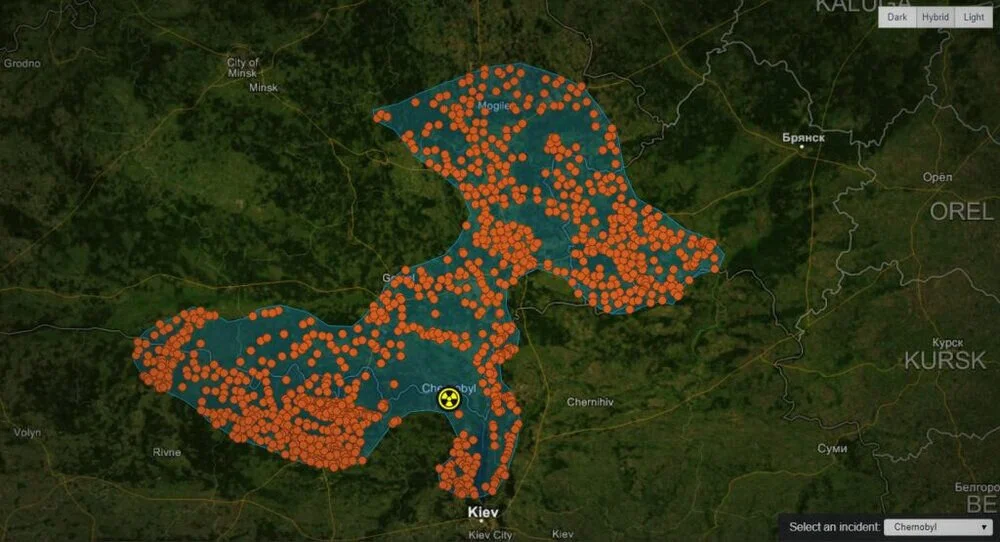
ThinkGeo Maps Query Sample Spotlight: Cities Affected by Nuclear Disasters
There have been a handful of nuclear power plant events that have had significant consequences for people, the environment and the facilities and workers of the plant. Sometimes the scope and radius of the area impacted by these events is minimized or not completely understood. Maps can help in painting that picture. ThinkGeo Cloud can go the extra mile and stress the importance and the magnitude of such events.

Routing Cost Matrix API added to ThinkGeo Cloud
Sometimes getting from point A to point B just isn’t enough. Sometimes there are points C-Z to factor into consideration and if that’s the case then odds are you need to know how long it’s going to take to get there too. Enter ThinkGeo’s Routing Cost Matrix API. This latest addition to our ThinkGeo Cloud arsenal introduces a simple service that calculates the time and/or distance between several waypoints.
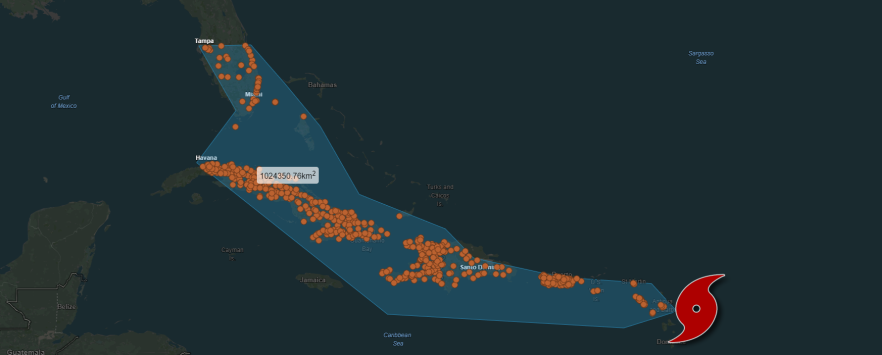
Maps Query Service added to ThinkGeo Cloud
ThinkGeo’s Cloud Maps Spatial Query Service is a data allocation haven. With it, you can free-draw, set lines and/or polygon contours for any portion of ThinkGeo’s World Maps and then extract a bevy of spatially-related data.
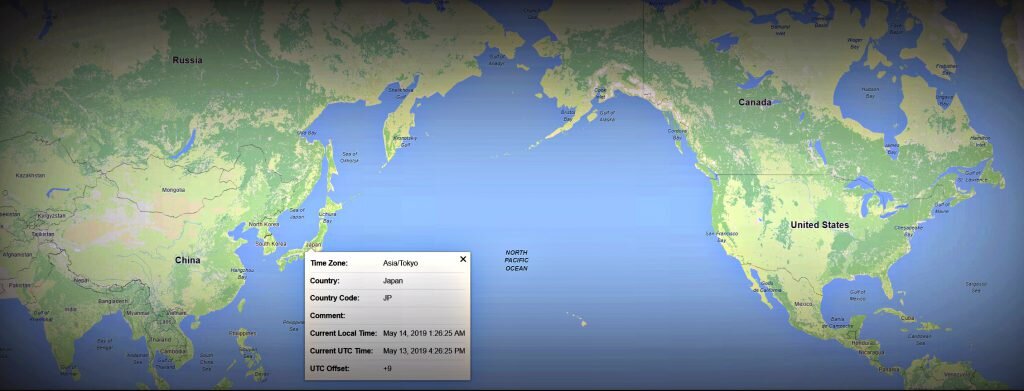
ThinkGeo Cloud’s Time Zone API
ThinkGeo has added a Time Zone API to our growing list of Cloud services. The importance of knowing what time zone different parts of the globe fall under is paramount in business. Whether its managing your fleet of vehicles that are spread out across continents or optimizing when you send messages out to business partners, the flow of productivity is crucial. If the product/service you provide can be globally consumed then your audience is the world and something as simple as knowing what time it is can go a long way.

Getting Technical: ThinkGeo Drawing Performance
This ThinkGeo WPF performance sample can render 16,000 count of rectangular shape features ; then it will distribute the shapes throughout 4 layers evenly. After clicking the [Start] button the sample application will update 1,600 rectangular shape features per 1,000 milliseconds, the time lapsed of the features being drawn will display in the application footer. Evaluators of the sample can modify the update rate, update features count, and enable or disable the layers.

Give Your Maps a Lift with ThinkGeo Cloud Elevation
Elevation data can have many practical uses in a variety of industries; from agricultural to urban development. Slope and aspect can be directly derived from rendering elevation points and getting precise feedback. ThinkGeo Cloud makes it easy to get that feedback.

ThinkGeo’s Color Generator & How We Built It
Using ThinkGeo Cloud’s Color Generator anyone can begin creating a visual map that highlights the data you want to use! Color is arguably the most important aspect of map creation and we’ve created a fun and easy to use generator to give you the head start you need. ThinkGeo’s Color Generator is included in our 60-day Free Evaluation of ThinkGeo Cloud.

ThinkGeo’s Chicago Crime Map & How We Built It
The infrastructure of cities can dictate crime frequency. The placement of buildings, main arteries, parks, alleys, and police stations can affect a city’s likelihood to experience crime. ThinkGeo’s mapping tools can highlight crime within cities so that we can study the results and see where the trouble spots are, and more importantly, enable law enforcement agencies to plan accordingly and notice trends.

Displaying ThinkGeo Cloud Maps in your Map Suite Applications
The following set of samples demonstrates how to display ThinkGeo Cloud Maps in your Map Suite GIS applications. Our new maps can be integrated into your project and applications for any of the following development platforms—>

Introducing the ThinkGeo Cloud XYZ Server
We’re pleased to announce the release of ThinkGeo Cloud XYZ. The XYZ Tile Server is a ThinkGeo Cloud plug-in and functions as a map server serving tiles based on location, or XYZs. It is one of the most popular ways to display and navigate maps in today’s technical environment.